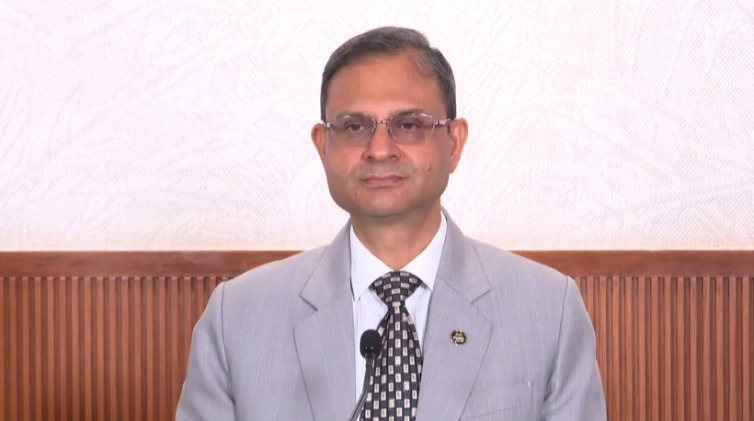
RBI Governor’s Statement on Monetary Policy Committee
The 55th meeting of the Monetary Policy Committee (MPC) was held in the backdrop of an early and promising start of the monsoon season, which is of vital significance for the Indian economy. In contrast, the global backdrop remains fragile and highly fluid. The uncertainty around the global economic outlook has somewhat ebbed since the MPC met in April in the wake of temporary tariff reprieve and optimism around trade negotiations.
The Monetary Policy Committee (MPC) met on the 4th, 5th and 6th of June to deliberate and decide on the policy repo rate. After a detailed assessment of the evolving macroeconomic and financial developments and the outlook, the MPC decided to reduce the policy repo rate under the liquidity adjustment facility (LAF) by 50 basis points to 5.50% with immediate effect; consequently, the standing deposit facility (SDF) rate shall stand adjusted to 5.25% and the marginal standing facility (MSF) rate and the Bank Rate to 5.75%.
Excerpts –
- As on May 30, 2025, India’s foreign exchange reserves stood at US$ 691.5 billion. These are sufficient to fund more than 11 months of goods imports32 and about 96% of external debt outstanding.
- To further provide durable liquidity, it has been decided to reduce the cash reserve ratio (CRR) by 100 basis points (bps) to 3.0 % of net demand and time liabilities (NDTL); the cut in CRR would release primary liquidity of about Rs.2.5 lakh crore to the banking system by December 2025.
- Credit Deposit ratio for the banking system at the end of December 2024 was at 81.84 %, broadly similar to a year ago.
- The Organisation for Economic Co-operation and Development (OECD) – United States, in its Economic Outlook released in June 2025, revised down the global growth forecast by 20 basis points to 2.9% for 2025 while the IMF in its April World Economic Outlook lowered the global growth projection to 2.8% for 2025 and 3.0% for 2026—well below the historical average of 3.7% recorded between 2000 and 2019. Furthermore, the WTO now projects world merchandise trade volume to contract by 0.2% in 2025, marking a notable downgrade of nearly 3 percentage points from earlier forecasts.
- Real GDP expanded by 7.4 % in Q4:2024-25. Private consumption and gross fixed capital formation (GFCF) grew by 6.0 % and 9.4 %, respectively, in Q4:2024-25. For the full year 2024-25, private consumption and GFCF expanded by 7.2 % and 7.1 %, respectively. On the supply side, gross value added (GVA) expanded by 6.8 % in Q4:2024-25. Manufacturing rose by 4.8 % and services registered growth of 7.9 % in Q4. For 2024-25, GVA expanded by 6.4 %. Manufacturing and services sector grew by 4.5 % and 7.5 %, respectively in 2024-25.
- As per the third advance estimates, the combined kharif and rabi food-grains production at 354.0 million tonnes in 2024-25 is 6.5% higher than a year ago.
- As of June 5, 2025, reservoir levels were at 31.1% of the full capacity, above last year’s level of 22.5% and higher than the decadal average of 24.2%.
- Procurement of wheat as on June 1, 2025 at 298.8 lakh tonnes is 13.3% higher over the last year.
- As on May 16, 2025, the stocks held by the Food Corporation of India for wheat stands at 5.1 times the buffer norms (highest in 4 years) and rice at 4.4 times the buffer norms.
- Index of Industrial Production (IIP) during April 2025 expanded at tepid rate of 2.7% despite a lower base of 4.0% growth in 2024-25. While mining contracted by 0.2% in April, electricity and manufacturing recorded growth of 1.1% and 3.4%, respectively. Manufacturing PMI for May 2025 moderated to 57.6 but remains well above the long-run average.
- E-way bills increased strongly by 23.4% in April 2025, while toll collections increased by 16.4% in May 2025. Gross GST collections rose by a healthy 16.4% in May 2025. Domestic air cargo posted a growth of 16.6% in April. Domestic air passenger traffic grew by 9.7% in April, however moderated to 3.7% in May. Port cargo witnessed a growth of 5.6% in April-May 2025.
- PMI services for May 2025 edged up to 58.8 from 58.7 in April, maintaining a level that reflects the sector’s recent stable and robust performance.
- IIP consumer durables expanded by 6.4% in April 2025.
- As per the Nielsen IQ’s Retail Audit Service, FMCG sales volume growth in rural areas improved to 8.7% in April 2025 from 8.1% in March.
- Wholesale passenger vehicle sales and FMCG products sales (urban) recorded a growth of 5.5% and 4.5%, respectively, during April 2025.
- Production and Imports of capital goods rose sharply by 20.3% and 21.5%, respectively, in April 2025. Steel consumption and cement production recorded double-digit growth in Q4:2024-25 before moderating to 6.0% and 6.7%, respectively in the month of April.
- Merchandise exports recorded a growth of 9.2% in April 2025 with non-oil exports growing at a healthy 10.3%.
- Non-oil non-gold imports witnessed a strong growth of 17.3%, with overall imports growing at 19.1%.
- Services exports increased by 18.6% during March 2025, on the back of robust software and business exports. However, it moderated to 8.8% in April 2025.
- Monsoon landed on coast of Kerala on May 24, 2025, eight days in advance. As per the IMD’s updated long-range forecast, monsoon season rainfall is likely to be 106% of the long period average (LPA) with a model error of ±4%.
- As per the Union Budget 2025-26, the central government’s effective capital expenditure (including grants-in-aid for creation of capital assets) is budgeted to grow by 17.4%.
- As per the early results of quarterly order books, inventories, and capacity utilisation (OBICUS) survey of RBI, seasonally adjusted capacity utilisation (CU) of manufacturing sector at 75.5% in Q4:2024-25 is above the long-period average of 73.9%.
- PMI manufacturing Future Output Index is at a healthy 63.1 in May 2025. Future Output Index has hovered above 60.0 since April 2023. Future Activity Index of PMI services rebounded in May after declining in April.
- As per the Ministry of Commerce and Industry, 99% of Indian exports to the UK will benefit from this Free Trade Agreement.
- CPI headline inflation declined by a cumulative 45 basis points during March-April 2025, from 3.6% in February 2025 to a low of 3.2% in April 2025 – the lowest reading since July 2019. As vegetable prices continued to record a strong seasonal correction, food inflation dropped to a 42-month low of 2.1% in April from 3.8% in February 2025. Fuel group, however, exited the deflationary zone, recording a year-on-year inflation of 1.4% in March 2025 and rose further to 2.9% in April 2025. CPI excluding food and fuel inflation also edged up to 4.2%, year-on-year, in April 2025 after remaining steady at 4.1% in March 2025. Gold, which has a share of 2.3% within CPI excluding food and fuel, contributed 21.4% to the core inflation in April 2025.
- Urban households’ perception of the current median inflation declined by 10 basis points (bps) and reached 7.7%, while their inflation expectations for the next three months remained unchanged at 8.9%. Moreover, their expectation for year ahead reduced by 20 bps to 9.5%. For rural households, the current perception of inflation reduced by 30 basis points (bps) to 6.3% in May 2025 as compared with the previous round. Moreover, their year ahead inflation expectation also declined by 40 bps to 8.9% in the latest survey.
- As per provisional figures, India’s services exports grew by 13.6% to US$ 387.5 billion during 2024-25, whereas services imports registered a growth of 11.4% (US$ 198.7 billion). Net services receipts reached an all-time high of US$ 188.8 during 2024-25. In April 2025, services exports grew by 8.8% to US$32.8 billion on a y-o-y basis, while services imports rose moderately by 0.9% (US$16.9 billion). Net services receipts at US$15.9 billion recorded a y-o-y expansion of 18.8%.
- India’s current account balance recorded a deficit of 1.1% of GDP in Q3:2024-25 lower than 1.8% of GDP in Q2:2024-25.
- India’s merchandise exports expanded for the second consecutive month, growing by 9.0% (y-o-y) to US$ 38.5 billion in April 2025. Merchandise imports at US$ 64.9 billion expanded by 19.1% (y-o-y) in April 2025. India’s merchandise trade deficit increased to US$ 26.4 billion in April 2025 from US$ 19.2 billion a year ago.
- During 2025-26 so far (up to June 4), foreign portfolio investment (FPI) to India registered net outflows of US$ 2.1 billion.
- Gross foreign direct investment (FDI) inflows remained strong, rising by around 14% to US$ 81.0 billion in 2024-25 from US$ 71.3 billion a year ago. However, net FDI inflows moderated to US$ 0.4 billion in 2024-25 from US$ 10.1 billion a year ago.
- Net inflows under external commercial borrowings (ECBs) to India increased to US$ 18.7 billion during 2024-25 as compared with US$ 3.6 billion a year ago. In April 2025, net ECB to India rose to US$2.8 billion from US$0.5 billion a year ago. Non-resident deposits recorded a higher net inflow of US$ 16.2 billion in 2024-25 than US$ 14.7 billion a year ago.
- India’s CAD stood at 0.7% of GDP in 2023-24 and 1.1% during Q3:2024-25 (0.9% in Q1:2024-25 and 1.8% in Q2:2024-25). India’s external debt to GDP ratio stood at 19.1% at end -December 2024 from 18.5% at end-March 2024.
- Open market purchases (including through NDS-OM) injected durable liquidity amounting to Rs.5.2 lakh crore since January. Additionally, term VRR auctions and USD/INR buy-sell swaps injected liquidity amounting to Rs. 2.1 lakh crore and Rs. 2.2 lakh crore, respectively, during the same period.
- The average bid cover ratio of daily VRRs was 0.26 during April-June (up to June 4).
- The WACR, on an average, traded 16 bps below the policy repo rate during April-June (up to June 4) as compared to 6 bps above the repo rate during February-March.
- In response to the policy repo rate cut of 50 bps in the current easing cycle (up to June 4), the WACR moderated by 70 bps, 3-month T-bill rate by 88 bps, 3-month CP issued by NBFCs by 143 bps and 3-month CD rate by 138 bps. The compression in CP and CD spreads over T-bill suggests easier financing conditions for banks and corporates. The average CP and CD spread over T-bill moderated from 134 bps and 108 bps, respectively in March to 82 bps and 65 bps, respectively in May.
- The weighted average lending rate (WALR) on fresh rupee loans and outstanding rupee loans declined by 6 bps and 17 bps, respectively, during February-April 2025, reflecting policy rate transmission to lending rates. The weighted average domestic term deposit rates (WADTDR) on fresh deposits declined by 27 bps, while WADTDR on outstanding deposits declined by 1 bp during February – April 2025.
- Scheduled Commercial Banks (SCBs) Parameters: The outstanding credit and deposit on a y-o-y basis increased by 11.03% and 10.18%, respectively, between March-24 and March-25. The system-level Capital to Risk Weighted Assets Ratio (CRAR) of 16.43% in December 2024 was well above the regulatory minimum level. Ratio of non-performing loans improved further (GNPA ratio at 2.42% in December 2024 vis-à-vis 2.96% in December 2023, NNPA Ratio at 0.55% in December 2024 vis-à-vis 0.69% in December 2023). SMA-2 ratio, the proportion of loans that are overdue by 61–90 days as a share of total advances — a lead indicator of the build-up of fresh stress in the banking book – remained stable on a y-o-y basis at 0.96% in December 2024 (0.90% in December 2023). Liquidity buffers were robust, with an LCR of 130.21% as of December end 2024. The annualised return on assets (RoA) and return on equity (RoE) stood at 1.37% and 14.14%, respectively, in December 2024. Net Interest Margin was 3.49% for December 2024. (3.64% in December 2023).
- Non-Bank Financial Companies (NBFCs) Parameters: Total CRAR of NBFCs was 26.22% and Tier I capital of 24.13% in December 2024, well above the minimum regulatory requirements. RoA for the sector, decreased from 3.11% in December 2023 to 2.86% in December 2024. GNPA ratio has improved from 2.70% in December 2023 to 2.53% in December 2024, while NNPA ratio remained almost same at 1.10% in December 2024 as compared to 1.11% in December 2023.
Team Maverick


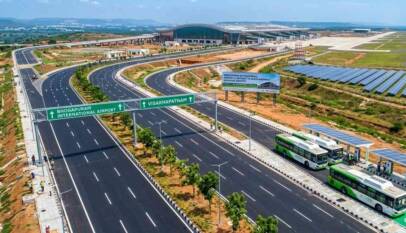
Chandrababu Naidu Reviews Preparations for PM Modi’s August 1 Inauguration of Bhogapuram International Airport
Amaravati, July 2026 : Andhra Pradesh Chief Minister N. Chandrababu Naidu on Monday conduc…
Chandrababu Naidu Reviews Preparations for PM Modi’s August 1 Inauguration of Bhogapuram International Airport
Amaravati, July 2026 : Andhra Pradesh Chief Minister N. Chandrababu Naidu on Monday conducted …