
Inflation and Economic Trends in India
- CPI inflation moderated to a 7-month low of 3.6% in February 2025, aided by a sharp decline in vegetable prices.
- Core inflation crossed 4% for the first time in 14 months, reaching 4.08%.
- Industrial growth strengthened, with IIP expanding by 5.0% in January 2025, led by manufacturing and mining.
- Rural inflation remains higher than urban inflation, influenced by food price trends.
- Imported inflation surged, rising from 1.3% in June 2024 to 31.1% in February 2025, driven by rising prices of precious metals, oils, and fats.
- RBI expected to implement at least 75 basis points of rate cuts in 2025, with successive reductions anticipated in April and August.
- Corporate performance remains strong, with revenue, EBITDA, and PAT growth of 6.2%, 11%, and 12%, respectively, in Q3FY25.
The above are the major findings of the SBI Ecowrap report, published by the State Bank of India’s Economic Research Department. SBI Ecowrap is a research report that analyzes the Indian economy, including GDP growth, agricultural reforms, and formal and informal economies. The latest edition of SBI’s Ecowrap, released on March 12, 2025, provides a detailed analysis of India’s economic landscape in February 2025. It focuses on Consumer Price Index (CPI) inflation, industrial growth, imported inflation, and corporate performance. The report highlights a significant moderation in inflation, particularly in food and beverages, while also projecting future trends in monetary policy and industrial output.
CPI Inflation Moderation
- India’s CPI inflation fell to a 7-month low of 3.6% in February 2025 due to a substantial decline in food and beverage prices.
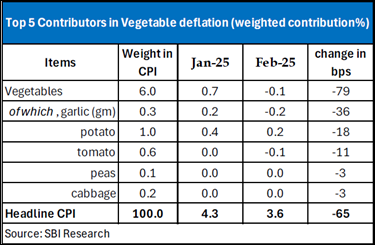
- Food & Beverages inflation eased by 185 basis points (m-o-m) to 3.84%, mainly due to a sharp decline in vegetable prices.
- Vegetable CPI declined sharply, entering negative territory (1.07%) for the first time in 20 months.
- Approximately 80% of this decline was attributed to garlic, potatoes, and tomatoes.
- A notable drop in garlic prices is potentially linked to dietary changes during the Maha Kumbh, which may have led to reduced consumption of non-vegetarian food.
- Fruit inflation surged to a 10-year high of 14.8%, potentially due to increased demand during fasting periods associated with the Maha Kumbh.
- Fuel and light deflation is still continued for 18 months.
- Non-vegetarian food inflation (Egg/Meat/Fish) decelerated, possibly due to the Maha Kumbh period.
- While overall inflation moderated, the core inflation crossed the 4.0% mark after 14 months to 4.08%. Core Inflation corresponds to the component of inflation that is likely to continue for a long period. Thus, core inflation captures the underlying trend of inflation and is, therefore, more stable.
Future CPI Inflation Trends
- CPI inflation is expected to decline to 3.9% in Q4 FY25 and average 4.7% for FY25.
- FY26 inflation is projected in the range of 4.0-4.2%, while core inflation may range between 4.2-4.4%.
- The Reserve Bank of India (RBI) may implement successive rate cuts in April and August 2025, with an overall expected cumulative rate cut of at least 75 basis points.
- The cycle of rate cuts may continue from October 2025, following an intervening gap in August 2025.
State-wise Inflation Analysis
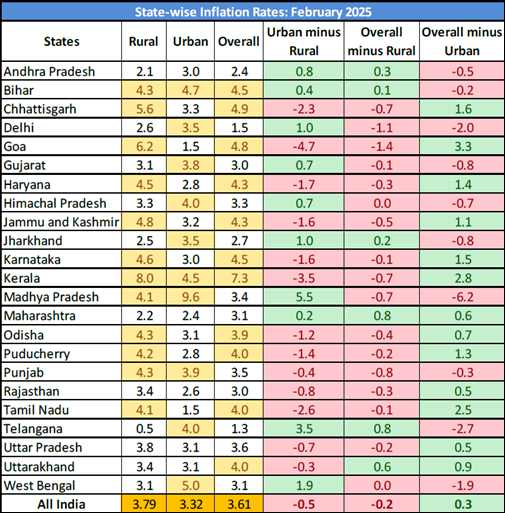
- 12 states recorded rural inflation above the national rural average.
- 10 states reported urban inflation higher than the national urban average.
- Rural inflation continued to outpace urban inflation due to higher food prices and a larger food basket share (54.2% for rural areas vs. 36.3% for urban areas).
- The highest inflation rates were recorded in Kerala (7.3%) and Chhattisgarh (4.9%).
| State | Rural Inflation (%) | Urban Inflation (%) | Overall Inflation (%) |
| Kerala | 8.0 | 4.5 | 7.3 |
| Chhattisgarh | 5.6 | 3.3 | 4.9 |
| Goa | 6.2 | 1.5 | 4.8 |
| Bihar | 4.3 | 4.7 | 4.5 |
| Karnataka | 4.6 | 3.0 | 4.5 |
- The lowest inflation rates were recorded in Telangana (1.3%) and Delhi (1.5%).
| State | Rural Inflation (%) | Urban Inflation (%) | Overall Inflation (%) |
| Telangana | 0.5 | 1.3 | 1.3 |
| Delhi | 2.6 | 3.5 | 1.5 |
| Goa | 6.2 | 1.5 | 1.8 |
| Maharashtra | 2.2 | 2.4 | 3.1 |
| Himachal Pradesh | 3.3 | 4.0 | 3.3 |
Rising Share of Imported Inflation
- Despite the overall decline in CPI inflation, the share of imported inflation rose from 1.3% in June 2024 to 31.1% in February 2025.
- Key drivers include rising prices of precious metals, oils, fats, and chemical products.
- The contribution of energy prices to imported inflation remains negative and in declining in absolute amount.
Industrial Growth and IIP Expansion
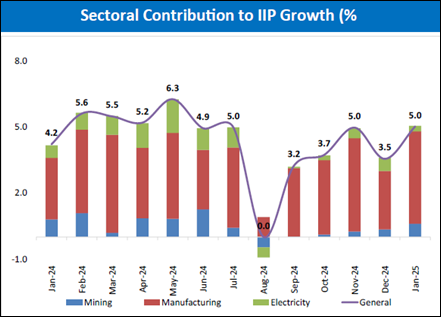
- India’s Index of Industrial Production (IIP) expanded by 5.0% in January 2025, the highest in eight months, compared to 3.2% in December 2024.
- The growth was driven by:
- Manufacturing sector: 5.5% growth
- Mining sector: 4.4% growth
- Primary goods: 5.5% growth
- Consumer Durables (long-term consumption goods): 7.2% growth
- Intermediate goods: 5.23% growth
- Consumer Non-Durables (immediate consumption goods) contracted by 0.2%, indicating weak demand in that segment.
Sectoral Growth Trends
- Capital Goods, Consumer Durables, FMCG, Healthcare, and Pharmaceuticals showed strong year-on-year growth in Q3FY25.
- The Interest Coverage Ratio of listed entities improved by 20 basis points in Q3FY25, reflecting improved margins and financial stability.
- More than 4000 corporates in the listed space reported revenue growth of 6.2%, with earnings before interest, taxes, depreciation and amortization (EBITDA) and profit after tax (PAT) growing by 11% and 12%, respectively, in Q3FY25 compared to Q3FY24.
- Corporate ex-BFSI (more than 3400 listed entities) reported revenue and PAT growth of 5% (recovering from negative growth in previous quarters) and 9% in Q3FY25, respectively.
Monetary Policy Outlook & Corporate Capex Cycle
- The combination of a strong balance sheet, comfortable interest coverage, and a downward interest rate cycle is expected to support the next capex cycle for Indian industries.
- Improved corporate margins and liquidity conditions make Indian Inc. well-positioned for capital expenditure growth.
- The aggregate EBITDA margin improved by 44 basis points in Q3FY25, reaching 14.84% from 14.4% in Q2FY25.
Conclusion
India’s economic indicators for February 2025 reflect a moderation in inflation, improved industrial output, and strong corporate earnings. While inflation trends remain favorable in the short term, imported inflation risks and rupee depreciation pose challenges going forward. The RBI’s expected rate cuts could further bolster growth, providing a positive environment for capex expansion and industrial performance. The evolving economic landscape suggests a cautious but optimistic outlook for the coming months.
References
https://www.indiabudget.gov.in/budget2019-20/economicsurvey/doc/vol2chapter/echap04_vol2.pdf
Annexure 1: State-wise Inflation Rates: February 2025


World Cup Heavyweights England and Argentina Set for Blockbuster Semi-final Showdown
Atlanta, July 2026 : The stage is set for one of the biggest matches of the 2026 FIFA Worl…

World Cup Heavyweights England and Argentina Set for Blockbuster Semi-final Showdown
Atlanta, July 2026 : The stage is set for one of the biggest matches …