

Deputy CM Ajit Pawar to Expedite Airport, Railway, and Key Pending Projects
Reviews Various Development Projects in Beed
No Shortage of Funds for Development Work
Beed : Deputy Chief Minister and Guardian Minister of Beed, Ajit Pawar, reviewed ongoing development projects in the district, including the status of the airport, railway projects, national highways, Zilla Parishad schemes, education initiatives, incubation centers, planetarium, and power distribution. He emphasized the collaborative efforts of the administration, public representatives, and citizens for the holistic development of Beed.
He assured that funds will not be a constraint for development work and that pending projects such as the airport and railway infrastructure will be fast-tracked.
Key Meeting at the District Collector’s Office
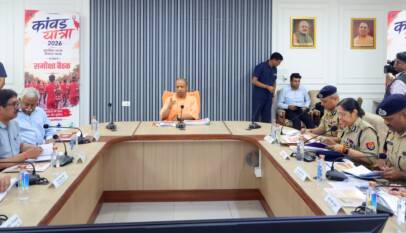
At the District Collector’s Office, Pawar conducted a comprehensive review along with Environment Minister Pankaja Munde, MLAs Satish Chavan, Vikram Kale, Prakash Solanke, Suresh Dhas, Sandeep Kshirsagar, Vijaysingh Pandit, Secretary to the Deputy CM Rajesh Deshmukh, Divisional Commissioner Dilip Gawde, District Collector Avinash Pathak, Superintendent of Police Navneet Kawath, and other key officials.
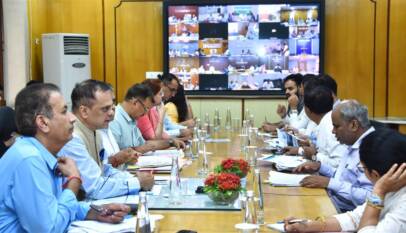
He highlighted that the state government will ensure adequate funding for development projects and accelerate long-pending railway projects. The Divisional Commissioner will oversee monthly progress updates on railway work, and any obstruction to railway projects will face legal action, including criminal charges.
Airport and Railway Development
The new airport will be constructed 14 km from Beed at Kamkheda, and the land acquisition process will commence soon. He assured that both airport and railway projects will be completed swiftly, and funding will not be an issue.
Housing and Infrastructure Projects
- 85,000 houses are under construction in Beed under the Prime Minister’s Housing Scheme, with a target to complete 75,000 houses soon.
- Diwali celebrations will mark the inauguration of newly completed homes, and 10 families who built homes without waiting for government funds were honored.
- ₹16.34 crore has been allocated to strengthen police stations, procure vehicles, and improve infrastructure.
- Weapons licenses issued earlier will be reassessed, and strict guidelines will be implemented for issuing new licenses.
Education and AI Training for Teachers
- The 2025 Foundational Literacy and Numeracy Quality Development Initiative was praised for improving students’ academic performance.
- ₹30 lakh has been allocated for AI training for teachers, with additional funds available through CSR and district planning schemes if needed.
- School safety measures, sanitation, and Anganwadi development will be prioritized.
Upgrading Beed’s Healthcare and Skill Development
- The Beed Government Medical College will mark its 50th anniversary next year, and necessary funds will be provided.
- Considering patient influx from Parbhani, Latur, and Dharashiv, additional healthcare facilities will be set up.
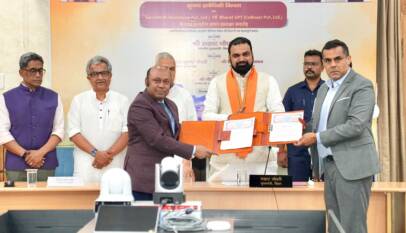
- Beed’s first Skill Development Center will be built in three acres of ITI land in partnership with Tata at ₹196.98 crore.
Timely Fund Utilization and Quality Assurance
- All development funds will be strategically allocated within the current financial year to ensure efficient use and high-quality execution before December 2025.
State-of-the-Art Planetarium in Beed
- A ₹20 crore planetarium will be built in Beed’s ITI campus to serve as both an educational hub for students and a tourist attraction.
- It will showcase student-created artworks and replicas of major tourist sites.
At the review meeting, District Collector Avinash Pathak presented an update on railway and airport projects, while other officials provided insights into ongoing development initiatives across different departments.


Drones Revolutionising Modern Warfare, Reshaping Global Defence Strategies
New Delhi, July 2026 : Drones have emerged as one of the most transformative technologies …

Drones Revolutionising Modern Warfare, Reshaping Global Defence Strategies
New Delhi, July 2026 : Drones have emerged as one of the most transformative …