
RBI Releases Urban Consumer Confidence Survey Report.
February 2026: The Reserve Bank has released the results of January 2026 round of its bi-monthly urban consumer confidence survey (UCCS).
The survey collects current perceptions (vis-à-vis a year ago) and one year ahead expectations of households on general economic situation, employment scenario, overall price situation, own income and spending. The latest round of the survey was conducted during 02nd January to 11th January 2026, covering 5,933 respondents across 19 major cities.
Highlights:
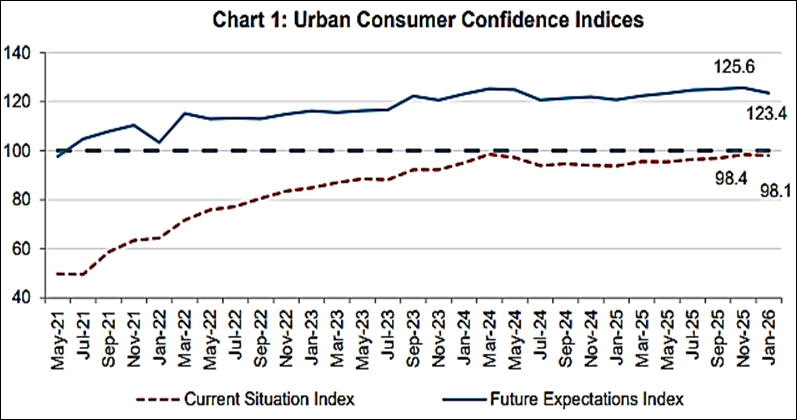
i. Consumer confidence for the current period changed marginally – the Current Situation Index
(CSI) 2 stood at 98.1 vis-à-vis 98.4 in the previous round (Chart 1).
ii. Consumer confidence for the year ahead ticked downward, owing mainly to lower expectations
on general economic conditions, income and price level compared to the previous round. Thus,
the Future Expectations Index (FEI), though in the optimistic zone, dropped by 2.2 points to
123.4 (Chart 1; Tables 1, 3 and 5).
iii. After showing improvement for three consecutive rounds, households’ current perception on
economic situation worsened. The future outlook also declined by 3.6 points, however remained
in the optimistic zone (Table 1).
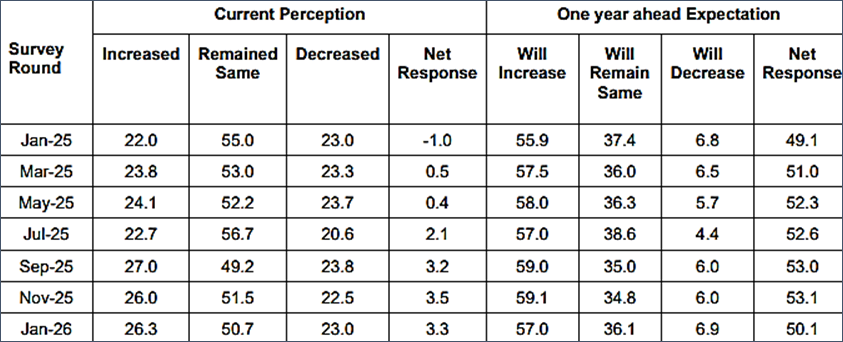
iv. Households’ sentiments on current earning remained stable. However, their year-ahead
expectations moderated (Table 5).
v. Household’s’ sentiments on price and inflation deteriorated for both the time horizons (Tables 3
and 4).
Important Note:
1. The survey results reflect the respondents’ views, which are not necessarily shared by the Reserve Bank. Results of the previous survey round were released on RBI’s website on December 05, 2025.
2. CSI and FEI are compiled on the basis of net responses on the economic situation, income, spending, employment and the price level for the current period (as compared with one year ago) and a year ahead, respectively. CSI and FEI = 100 + Average of Net Responses of the above parameters.
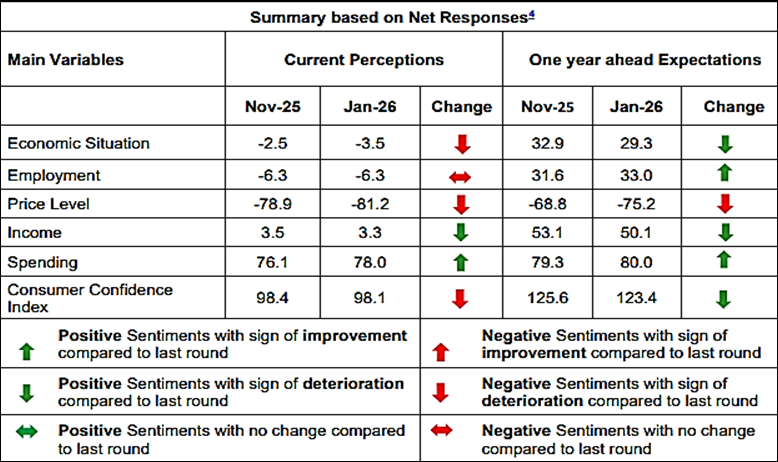
Table 1: Perceptions and Expectations on the General Economic Situation:
(%age Response)
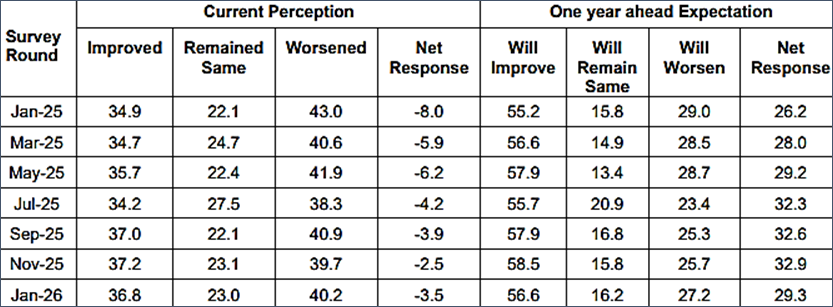
Table 2: Perceptions and Expectations on Employment: (%age Response)
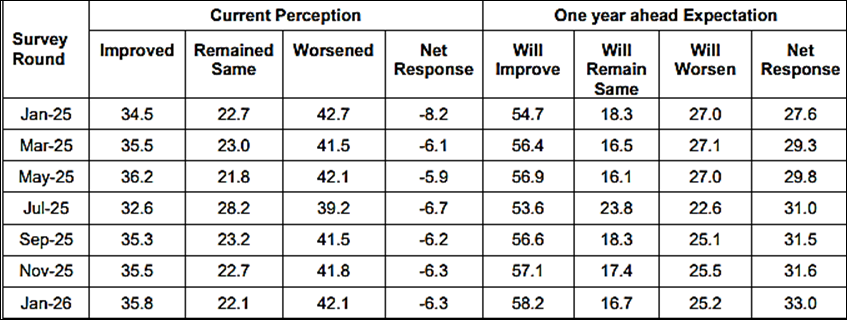
Table 3: Perceptions and Expectations on Price Level: (%age Response)
Table 4: Perceptions and Expectations on Rate of Change in Price Level (Inflation): (%age Response)
Table 5: Perceptions and Expectations on Income: (%age Response)
Team Maverick.


Tulsi Gabbard Resigns as US Intelligence Chief Amid Family Health Crisis
Washington, May 2026 : Tulsi Gabbard has resigned from her position as the United States D…
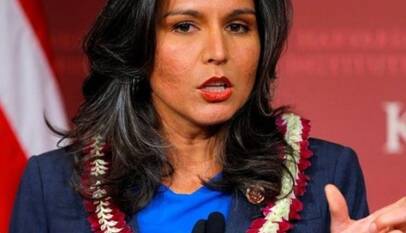
Tulsi Gabbard Resigns as US Intelligence Chief Amid Family Health Crisis
Washington, May 2026 : Tulsi Gabbard has resigned from her position as the United …