
El Niño And La Niña Are Synchronising Droughts And Floods Worldwide.
January 2026: Over the past two decades, Earth’s most severe droughts and floods have not occurred in isolation. Instead, they have manifested and erupted together across continents, driven by powerful climate cycles in the Pacific Ocean. A new global analysis shows that El Niño and La Niña have acted as the dominant forces synchronizing water extremes worldwide, linking distant regions through a shared hydrological rhythm.
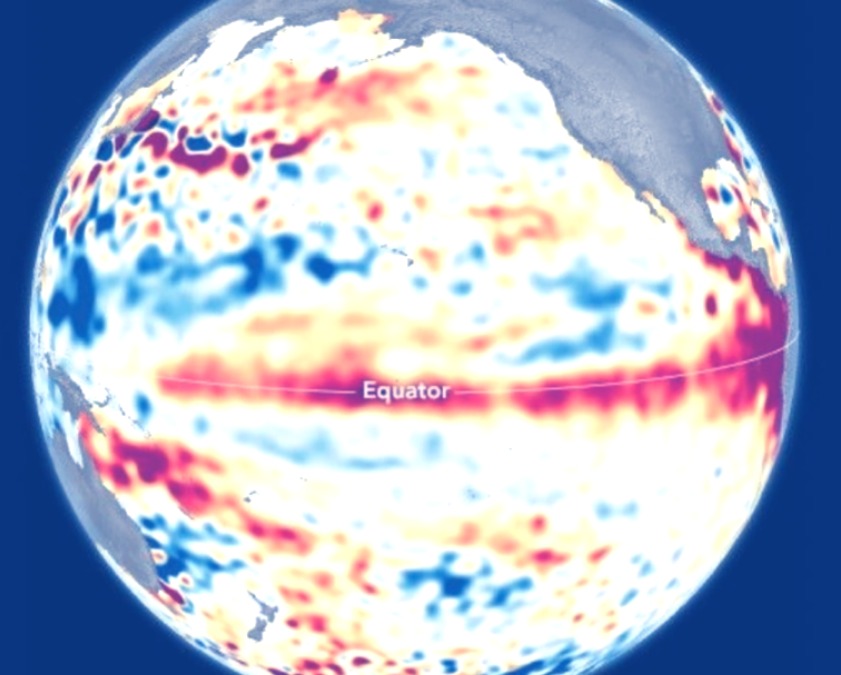
Using satellite gravity data collected between 2002 and 2024, researchers found that large-scale climate patterns associated with the El Niño–Southern Oscillation, or ENSO, determine when and where extreme wet and dry conditions emerge across the planet. When ENSO shifts phase, vast regions can become unusually wet or dry at the same time, amplifying risks to food systems, water supplies, ecosystems, and economies.
Scientists from the University of Texas at Austin led the study, which was published in AGU Advances. The research focuses on total water storage, a comprehensive measure that captures all water stored on land, including rivers, lakes, snow, soil moisture, and groundwater. Because total water storage integrates changes over months to years, it provides a uniquely powerful lens for tracking droughts and floods at continental and global scales.
Total water storage is formally recognised as an Essential Climate Variable, placing it alongside temperature, precipitation, alongside sea level as a core indicator of Earth system change. Unlike rainfall alone, it reflects how water accumulates and depletes over time, revealing the climate system’s memory and resilience.
To observe these changes, the researchers relied on measurements from NASA’s Gravity Recovery and Climate Experiment satellites and their successor mission, GRACE Follow On, operated by NASA. These satellites do not measure water directly. Instead, they detect tiny variations in Earth’s gravity field caused by the movement of mass, including shifts in water stored on land. From these signals, scientists can estimate changes in water storage across regions roughly 300–400 km (190–250 miles) wide, an area comparable to the US state of Indiana.
Rather than counting individual droughts or floods, the researchers examined how extremes are spatially connected. They defined wet extremes as months when water storage exceeded the 90th percentile for a region, and dry extremes as months below the 10th percentile. By analysing whether these extremes occurred simultaneously across different parts of the world, the team was able to extract far more information than traditional event-based approaches allow.
This spatial perspective revealed ENSO as the dominant global driver of water storage extremes. El Niño and La Niña operate on a roughly 02 to 03 year cycle, and the study shows that they synchronise droughts and floods across continents. Dry extremes align with El Niño in some regions and with La Niña in others, while wet extremes show the opposite pattern. The result is a planet-wide pattern in which distant regions experience extremes in lockstep.
Real-world examples illustrate this global synchronisation. During the strong El Niño event of 2015 to 2016, severe dry conditions developed simultaneously across the Amazon basin and southern Africa. Earlier El Niño episodes in the mid-2000s produced similar drought signatures in South Africa. In contrast, the powerful La Niña of 2010 to 2011 coincided with exceptional wet conditions in Australia, South Eastern Brazil, and Southern Africa, leading to widespread flooding.
The study also uncovered a striking asymmetry between wet and dry extremes. Drought-related water deficits tend to spread over larger areas, showing strong spatial coherence across continents. Flood-related water surpluses, while more localised, are much more intense. On average, wet extremes reach about twice the magnitude of dry extremes when measured in terms of total water storage.
This imbalance reflects fundamental hydrological constraints. Rainfall and runoff can rapidly increase water storage, while drying slows once soils and shallow reservoirs are depleted. Groundwater plays a critical buffering role in this process.
During dry periods, groundwater sustains rivers and ecosystems long after rainfall has stopped. During wet periods, depleted aquifers can absorb large volumes of excess water, temporarily reducing flood peaks and storing water for future droughts.
The influence of groundwater is so large that during the 2010 to 2011 La Niña, the amount of water stored on land increased enough to lower global mean sea level by several millimetres, a planetary-scale signal captured by satellite gravimetry.
Beyond ENSO’s familiar rhythm, the researchers identified a weaker climate cycle operating over roughly six to ten years. This quasi-decadal pattern produced a global shift in water extremes around 2011 to 2012. Before 2011, wet extremes were more common worldwide. After 2012, dry extremes became dominant, particularly across interior Asia, the western United States, and southern Africa. This transition reflects changes in the background Pacific climate conditions rather than a sudden long-term trend.
Despite dramatic variability, the study finds no statistically robust global trend toward stronger droughts or floods over the 22 years satellite record. Wet and dry extremes remain tightly linked in time, but their overall intensity has not shown a consistent increase or decrease.
Human water management further complicates the picture. Reservoir operations, irrigation, groundwater pumping, and managed aquifer recharge all alter baseline water storage and reshape how extremes appear in satellite observations. Large dams can suppress downstream flooding while deepening upstream deficits during prolonged dry periods. Intensive groundwater extraction lowers storage levels and lengthens recovery times after drought, introducing signals that are not directly tied to climate variability.
To bridge gaps in the satellite record, including an 11 month gap between missions in 2017 and 2018, the researchers used probabilistic models based on recurring spatial patterns to reconstruct water storage extremes. These reconstructions successfully reproduced the timing and geography of major wet and dry episodes, providing a continuous global picture of water extremeness from 2002 to 2024.
According to study co-author Bridget Scanlon, understanding these global connections has direct humanitarian and policy implications. When large regions become wet or dry at the same time, water availability, food production, and trade are all affected on a global scale. While Lead author Ashraf Rateb emphasised that focusing on spatial synchronisation rather than isolated disasters offers a clearer view of the climate processes driving droughts and floods worldwide.
Team Maverick.


PM Modi, Australian Opposition Leader Angus Taylor Reaffirm Bipartisan Commitment to Stronger India-Australia Ties
Melbourne, July 2026 : Prime Minister Narendra Modi on Friday met Australian Opposition Le…

PM Modi, Australian Opposition Leader Angus Taylor Reaffirm Bipartisan Commitment to Stronger India-Australia Ties
Melbourne, July 2026 : Prime Minister Narendra Modi on Friday met Australian Opposition Leader …